Value pressure
Restaurant research keeps pointing to price sensitivity, convenience and memorable experience as the themes operators must design around.
Source: McKinsey
Business guides
Frozen yoghurt sells customisation and a lighter treat. The model depends on foot traffic, topping discipline, machine uptime and whether customers return after the first novelty visit.
Localise this guide
Overview
The shop works when self-serve theatre lifts average spend without letting toppings, waste and machinery erode margin. In practical terms, this is the frozen yoghurt shop investment story about family and student traffic, evening/weekend patterns, warm-weather demand and competitor dessert queues, price per weight, topping mix, machine yield, waste, labour and repeat promotions, and the discipline to avoid installing too many machines or toppings before proving repeat local demand.
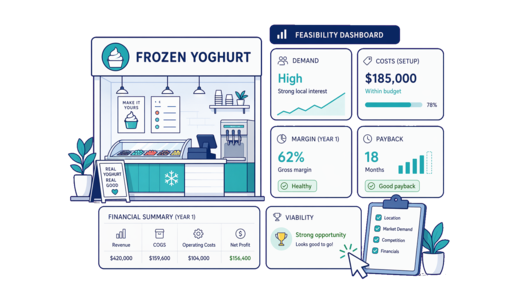
Key stats
Value pressure
Restaurant research keeps pointing to price sensitivity, convenience and memorable experience as the themes operators must design around.
Source: McKinsey
Food safety is not optional
Food businesses need documented food handling, allergen and hygiene processes before launch, not after the first complaint.
Benchmark the margins
Tax-office small-business benchmarks are useful sense checks for food cost, labour and rent assumptions, even though your site still needs its own model.
Source: ATO
Key concepts
Every topping adds stock, hygiene, expiry and replenishment work.
Price-per-weight models need clear customer expectations to avoid bill shock.
The best range feels abundant without becoming operationally messy.
Model machine capacity, maintenance and downtime before assuming self-serve efficiency.
A broken machine during a peak can damage both sales and trust.
Seasonality and weather should shape staffing and production.
Audience and industry
This guide is for founders, buyers and side-hustle operators asking whether the frozen yoghurt shop deserves more time, money and professional due diligence.
Custom dessert remains appealing, but novelty concepts need habit-building to avoid fading after launch buzz.
Compare gelato, bubble tea, dessert bars, supermarkets, cafes and fast-food desserts.
Key factors
family and student traffic, evening/weekend patterns, warm-weather demand and competitor dessert queues
price per weight, topping mix, machine yield, waste, labour and repeat promotions
machine uptime, topping bar maintenance, queue flow, hygiene checks and freezer/storage capacity
installing too many machines or toppings before proving repeat local demand
a clean, fun, customisable treat bar with a focused topping range and clear value cues
Finance model
Business Model Canvas
families, students, health-leaning treat buyers and groups seeking a custom dessert experience
a clean, fun, customisable treat bar with a focused topping range and clear value cues
Volume multiplied by realised price, with add-ons and repeat frequency tested separately.
Direct costs first, then rent, wages, utilities, software, maintenance, marketing and startup capital.
Conservative assumptions, staged spending, local quotes and clear break-even checks before commitment.
Common mistakes
Mistaking opening-week attention for repeat demand.
Separate curiosity traffic from customers who return at sustainable prices.
Letting the lease decide the business model.
Model rent and fixed costs against a conservative demand case before signing.
Ignoring the operating bottleneck.
Check machine uptime, topping bar maintenance, queue flow, hygiene checks and freezer/storage capacity before assuming more sales are physically possible.
Underfunding the ramp-up period.
Keep working capital for delays, training, mistakes, repairs and slower-than-planned demand.
Case studies
A compact scenario showing how one assumption can change the result.
A compact scenario showing how one assumption can change the result.
Decision tree
Move to quote-based costing and capacity stress tests.
Pause spending and collect better local evidence first.
Test whether the upside case is operationally deliverable.
Reduce fixed costs, narrow the offer or find a different site.
Turn that promise into menu, pricing, staffing and marketing decisions.
Sharpen the concept before committing capital.
Self-evaluation
Early stage: tighten the assumptions before treating this as feasible.
Decision point
Use the simulator as a structured sanity check. It should support adviser conversations, not replace them.
Test your idea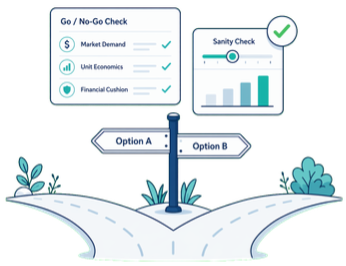
Where you trade
The guide above works as a general planning framework. Pick your country for rules, taxes and local context.

Checklist
FAQ
Start with conservative local evidence for demand, pricing, direct costs, staffing, rent and startup money. The simulator turns those assumptions into revenue, cost, profit, break-even and payback outputs.
No. Calculations are deterministic and based on the assumptions you enter. AI-generated text only explains results and does not recompute them.
No. It is an early planning tool to help you ask better questions before speaking with an accountant, broker or qualified adviser.
Use the optional independent-versus-franchise comparison with the terms from the disclosure document and agreement. Treat the initial fee as startup capital; enter the royalty and brand fund as percentages of modeled gross revenue; and enter required local marketing as a monthly fixed cost in addition to your existing local marketing budget. Confirm the eligible gross-revenue definition, supplier restrictions, territory, renewal, transfer and exit conditions before relying on the comparison.
Choose exactly one method: total monthly payroll, hours multiplied by hourly rate, or a detailed staff roster. Do not enter the same owner or staff cost in more than one method, and do not duplicate an owner cost in both payroll or the roster and a separate owner-cost field.
Sources
Disclaimer: smallbizsim.com provides indicative planning estimates only. It is not financial, legal, tax or investment advice. Verify assumptions with qualified advisers before making decisions.